Get the latest Laravel/PHP jobs, events and curated articles straight to your inbox, once a week
Source: medium.com
Getting started with Charts in Laravel 7Category: Laravel, javascript
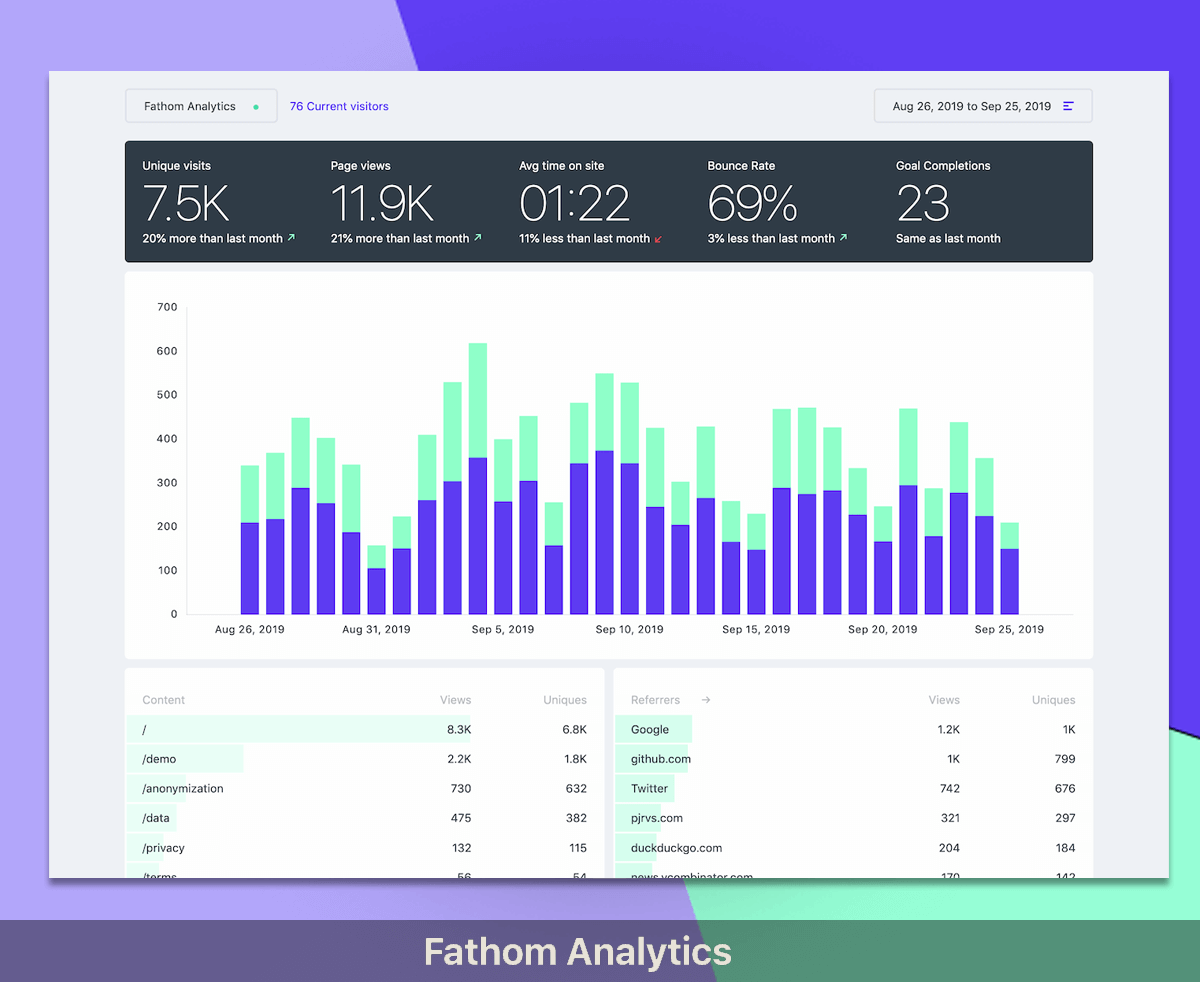
Charts of all types, shapes and sizes are a familiar sight across the web; especially within SAAS apps, news articles, or analytics tools, and if you’re developing an application you’ve probably considered including some sort of graph or chart functionality to display data. Getting a basic chart to display in Laravel is a simple process using a JavaScript charting solution, in this example we will be using Chart.js.
You can check out our article on using faker to create random Users for more detail but for this example we’ll create a database migration to add an age column by using: php artisan make:migration --table='users' 'add_age_to_users_table'
Add the following to the run function: factory(App\User::class, 5)->create(); When run, this will create 5 users, change 5 to any number of users you require.
Now we need to create an index.blade.php in /resources/views/charts/ and add the following (depending on your blade setup and layout - this is an example): Finally in /routes/web.php we need to add the following: Route::get('/charts', 'ChartController@index')->name('charts'); Now go to your-project-name.test/charts and you should see something like the following: You can check out the Chart.js docs for further information on customising your charts but hopefully this gives you a starting point to understand the basics of charts and graphs in Laravel.
Newsletter

Glimpse
Glimpse streamlines Laravel development by seamlessly deploying GitHub pull requests to preview environments with the help of Laravel Forge.
Laravel/PHP Careers


